Accurately mapping reads to a reference sequence is one of the most critical tasks for next-generation sequencing, yet it remains one of the most challenging areas of bioinformatics. Certainly, we’ve come a long way since ELAND and Maq. Dozens of new mapping and alignment algorithms have been published. Speed and sensitivity continue to improve; with BWA, we can map a lane of Illumina data (2×100 bp) to the human genome in about four hours. Nevertheless, it seems like most of the problems that arise in downstream analysis can be traced back to the read alignments.
Mapping Error: Consequences and Causes
Take variant calling, for example. The two central issues we try to address are false positives (variants that aren’t real) and false-negatives (real variants that are missed). Countless hours of manual review and extensive validation have shown that false positives rarely arise from simple sequencing errors. Such errors occur randomly, and with sufficient read depth (8x-10x), they can be readily ignored as background noise. Instead, most false positives are the result of an alignment errors – reads mapped to the wrong place, local mis-alignment around indels, etc. False-negatives are also a concern, particularly for indels. Why? Because the larger the gap between read and reference sequence, the more difficult it is to place correctly.
In my humble opinion, three factors contribute to the problem of accurate read mapping: relatively short read lengths (36-100 bp), unprecedented throughput of NGS instruments, and size/complexity of the genome. As a bioinformatician, I can’t do much about the first two. The size and complexity of the genome, however, remains somewhat fixed. As such, many groups have sought to define those portions of the genome that are “mappable”, so that they can be prioritized for analysis.
Quantifying Short Read Mappability
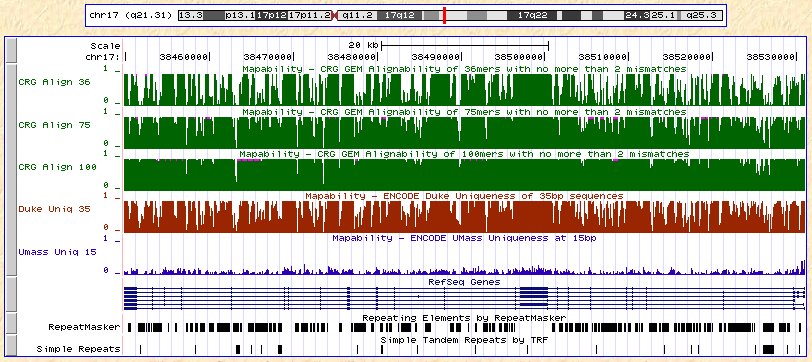
Recently, I noticed that several such datasets have been incorporated as tracks in the UCSC Genome Browser. For build 18 (NCBI 36), there are about a dozen of them, all under the track name “Mapability”. Here are some of them across the BRCA1 gene region on chromosome 17:

The top three tracks (in green) represent mappability with 36, 75, and 100bp reads as calculated by CRG-GEM, a suite of genome analysis tools by a group in Spain. Then there’s Duke uniqueness (35 bp) in red, and UMass uniqueness (15 bp) in blue. Looking at the tracks together, a few patterns become apparent: first, that mappability calculations remain fairly consistent across datasets generated by different groups. Most of the drops in mappability correspond nicely to RepeatMasker regions. Also, if the CRG results are accurate, the mappability increases substantially with read length (although the near-complete mappability for 100-mers seems a bit optimistic). This dovetails nicely with the theoretical expectation that longer reads can resolve more of the genome.
Utilizing Genome-Wide Mappability Scores
How might this information assist bioinformaticians with the analysis of NGS data? I have a few ideas. It could be used to normalize sequencing coverage by local mappability, for read-depth-sensitive measurements like genome-wide copy number. It can be plotted alongside whole-genome sequencing or capture coverage read depth, to help explain holes in coverage.
It could even be used pre-emptively, for targeted sequencing projects, to assess the regions that will or will not have reads mapped. This sort of analysis is useful to set realistic expectations for collaborators, who might expect that, since they’ve heard so many nice things about next-gen sequencing, it will yield beautiful, even coverage across every single base they want. For time-sensitive projects, you could even adapt a sequencing strategy based on this information. On the Illumina platform, for example, a 36-bp fragment-end run finishes days before a paired-end run of longer reads. If one’s target regions were very mappable, and time was of the essence, a faster and less expensive sequencing run could be ordered.


