The incredible throughput of current second-generation sequencing platforms makes it possible to sequence a complete human genome to high coverage, with a single instrument run, in less than 2 weeks. As whole-genome sequencing becomes more routine, it is increasingly important to understand the accuracy of sequence-level analyses, such as SNP detection, and its relationship to overall sequence depth. Enter a recent study from the lab of Elliott Margulies at NHGRI. As part of the NIH Undiagnosed Diseases Program, the authors generated over 380 gigabases of sequence data from the blood sample of a male patient. This is an astonishing amount of sequence for one sample, roughly 126-fold theoretical redundancy genome-wide.
Perhaps just as importantly, the dataset comprised four runs on two different but related platforms: the Illumina GAIIx, and the Illumina HiSeq2000. Here is a brief summary of the dataset.
| Dataset | Total Gbp | Map Rate | Dup. Rate | Mapped Depth | % Genome Callable |
| GAIIx (14 lanes) | 118 | 95.3% | 3.9% | 34.2x | 88.82% |
| HiSeq A (8 lanes) | 122 | 94.0% | 13.7% | 32.7x | 90.99% |
| HiSeq B (8 lanes) | 144 | 92.6% | 8.7% | 40.4x | 93.10% |
| All (30 lanes) | 384 | 93.9% | 13.6% | 102x | 95.88% |
With this impressive dataset in hand, the authors undertook a detailed examination of the technical aspects of sequence analysis: coverage uniformity, platform comparisons, genotyping accuracy, etc. and seek to answer two questions:
- Given a specific amount of sequencing data, what fraction of the genome is “callable”?
- How many SNVs can be accurately identified?
The results, I think, are critically important in the near future as whole-genome sequencing becomes routine and widely accessible to investigators.
Coverage Versus Callability
The authors correctly note that while many studies report “coverage” of genomes or exomes in terms of minimum depth achieved (1x, 5x, 10x, etc.), this metric alone is insufficient. Namely, it may not include information about alignment and quality filters, as well as the requirements of genotype calling algorithms. A better approach might be to report the fraction of the genome/exome that is “callable” – where genotypes can be determined with at a specified confidence threshold when all filters are applied. This term is roughly equivalent to what the 1000 Genomes Projects calls the “accessible” portion of the genome. In this study, the authors calculate callability by:
- Starting with reads that pass the Illumina chastity filter
- Further removing reads with <32 Q20 bases
- Mapping reads to the reference sequence using BWA
- Removing duplicates (using SAMtools rmdup)
- Considering only bases with quality >= 20.
- Requiring a genotype probability score of 10.
The last metric refers to the score from the group’s Bayesian genotype calling algorithm, Most Probable Genotype (MPG). An MPG score of 10 is a log-scaled value indicating a 1/e^10 (that’s 1/22026) theoretical probability of being incorrect. By these criteria, 88.82% of the genome was callable in the GAIIx dataset (34.2x mapped depth) and 90.99% was callable in the HiSeq-A dataset (32.7x).
You may notice that the GAIIx platform had more mapped bases but yielded a lower callability than HiSeq-A, and wonder, how could this be? It has long been observed that coverage is non-uniform across the genome and follows a Poisson distribution, influenced by factors such as read length, region mappability, and GC content. Although the amount of sequence data was similar, HiSeq platforms achieved a more uniform coverage than GAIIx, yielding more callable bases genome-wide.
GAIIx vs HiSeq Coverage of the Genome and Exome
To enable some direct comparisons, the authors normalized the HiSeq2000 data into a set of equivalent size to the GAIIx datset (34.2x average mapped depth), then assessed coverage of the genome as well as the exome (here defined as ~34 Mbp of non-redundant coding sequence from the UCSC Known Genes). Here’s a plot of the Q20 coverage for GAIIx and HiSeq values from Supp. Table 1.
On both platforms, around 97% of the genome was covered by at least one read. At 10x coverage, however, GAIIx covers 89.4% of the genome whereas HiSeq covers 92.2%. These differences were even more pronounced in the exome, where GAIIx and HiSeq covered 67.4% and 76.2% of the exome at 10x, respectively. Since both platforms performed unbiased whole-genome sequencing, the authors conclude that HiSeq’s superior coverage comes from a better representation of high-GC-content sequences, which tend to have higher gene density.
Filters for Accurate Genotype Calling
The authors next undertook a careful experiment to establish appropriate filters for SNV calling genome-wide. Pooling all Illumina data together, they generated two equal-sized datasets with an average mapped coverage of 50x by random read sampling. Next, they compared genotype calls at all bases that were “callable” with MPG score >=10. Among the 2.8 billion positions (98.3% of the genome) that met these criteria in both datasets, there were 46,580 discordant genotypes. Many of these, unsurprisingly, arose from sequence reads that were improperly aligned (misplaced, or locally mis-aligned). To address this, the authors removed reads with mapping quality <30 from both datasets. This mapping quality filter reduced the comparison set to 93.6% of the genome, but removed 81% of discordant calls.
Among the 8,710 remaining discordant positions, the authors observed consistently lower MPG scores than were seen among concordant positions, particularly at high coverage sites. They made perhaps one of the most useful inferences of this study: that genotype accuracy can be improved by requiring higher probability scores at higher sequence depths. Basically, they required that, for a given position, the ratio of MPG score to Q20 coverage be at least 0.5. The confidence-by-depth filter removed 61.5% of discordant positions but reduced callability by just 0.02%.
Finally, the authors employed the widely used strategy of removing SNV calls within 10 bp of called indels. This indel-nearby filter removed 26% of the remaining discordant positions, while reducing callability by 0.43%. Thus, by applying three filters aimed at reducing false positives, the authors removed 96.4% of discordant positions and maintained callability across 93.13% of the genome.
How Many Variants Can Be Detected?
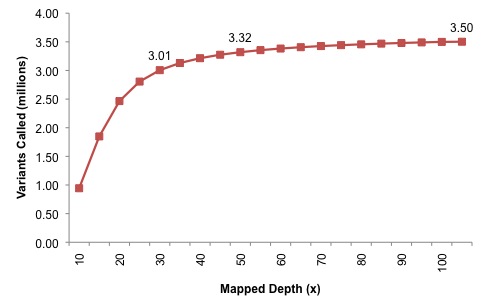
The next experiment was quite interesting: the authors pooled all Illumina data, and progressively added reads to create datasets of 5x, 10x, 15x mapped coverage, all the way up to 100x. In each dataset, they applied their variant calling with all filters, then reported the number of SNVs that were identified. I’ve generated a plot of the number of SNVs called genome-wide by dataset:
At 30x, which might be considered a de facto standard, around 3 million variants were identified. Each new depth adds perhaps 10,000 variants, but at 50x the discovery power is nearly saturated (3.32 million, or 95% of the total). Very little is gained going from 50x to 105x, although, if the relationship between genes, GC content, and callability holds true, many of these could be coding variants. In summary, deep resequencing of a sample to 105-fold coverage tells us that a typical human genome contains around 3.5 million SNPs. That’s very close to estimates from the personal genomes that have already been published (~3.1 m to 4.1 m SNPs), which I find reassuring. It would be informative to see a similar experiment on a sample of African origin, where the number might be closer to 4.5 million.
The Sweet Spot of Coverage and Callability
Based on these experiments and their callability calculations, the authors estimate that generating 50x mapped coverage (60x before read mapping/filtering are applied) renders ~95% of the genome and ~81% of the exome callable. Intriguingly, however, the authors note that they’d sequenced an unrelated sample using the latest HiSeq chemistry and basecalling software, achieving the same level of callability with just 35x mapped coverage. If anything, this emphasizes that (as the authors suggest), a “callability” metric is far more informative to report when describing the resequencing of human genomes.
References
Ajay SS, Parker SC, Ozel Abaan H, Fuentes Fajardo KV, & Margulies EH (2011). Accurate and comprehensive sequencing of personal genomes. Genome research PMID: 21771779


