As long-time readers of MassGenomics probably know, I’m fascinated by studies that interrogate functional elements of the human genome. The ENCODE Project is perhaps the most visible consortium effort in the United States, employing a variety of high-throughput genomic technologies such as RNA sequencing (expression), DNase I sequencing (open chromatin), and CHiP-Seq (DNA-protein interactions).
However, other groups have made major contributions recently, notably RIKEN-led FANTOM consortium. In the past few years, FANTOM researchers have applied Cap Analysis Gene Expression (CAGE), a genomic technology developed at RIKEN, to numerous mammalian cell and tissue types. CAGE isolates the 5′ end of long RNA molecules, providing high-resolution mapping of the transcription start sites and core promoters of genes. The current project iteration, FANTOM5, has mapped enhancers and transcription start sites in hundreds of primary human cell types.
This week in Nature, they’ve published another genomic annotation: an atlas of long non-coding RNAs with accurate 5′ ends. By integrating 1,829 CAGE profiles from the FANTOM project with transcript models from a variety of sources (GENCODE, Human BodyMap, ENODE, and miTranscriptome), the authors constructed a “CAGE-associated transcriptome” assembly cleverly branded FANTOM CAT.
Atlas of Long Noncoding RNA Genes
The 27,919 long noncoding RNA genes in FANTOM CAT represent the most comprehensive catalogue of human lncRNAs so far. The authors next sought to classify lncRNA genes according to genomic and epigenomic context. I found the way this was presented in the paper to be very confusing, so I’ve broken it down differently here.
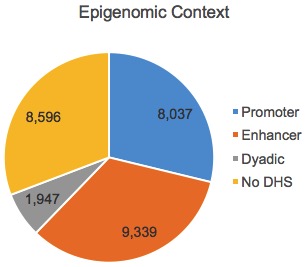
First, the authors assigned lncRNAs to an epigenomic class based on the overlap between their strongest transcription start site (TSS) with DNase I hypersensitive regulatory regions defined by the RoadMap Epigenomics Consortium:
Dyadic here means a DHS that looks like both a promoter and an enhancer. So that’s the epigenomic context. The authors also assigned lncRNAs to a genomic context based on their location and transription relative to messenger RNAs:
Divergent here means that a lncRNA seems to use the same TSS as the mRNA, but is transcribed in the other direction. Using these epigenomic and genomic classifications, the authors defined some lncRNA categories for deeper analysis:
- Divergent p-lncRNAs (n=5,827) have promoter-like epigenomic signatures and use the same TSS as a known messenger RNA, but are transcribed in the other direction.
- Intergenic p-lncRNAs (n=1,725) also have promoter-like epigenomic signatures but do NOT use the same TSS as a known messenger RNA.
- e-lncRNAs (n=9,339) have enhancer-like epigenomic signatures (genomic context is ignored). These are the orange slice from the top pie chart.
There were also 10,543 lncRNAs that had have dyadic or undefined epigenomic signatures, or that had a promoter epigenomic signature but were antisense or intronic. These “other” lncRNAs are essentially set aside; in most of their analyses, the authors compare/contrast the three lncRNA categories described above with traditional mRNAs.
Conservation of lncRNAs
One way to assess the functional relevance of a genomic region (or set of regions) is to assess the extent of evolutionary conservation across species. In this study, the authors examined whether the transcription initiation region (TIR) and exonic sequences were conserved for each class of lncRNA gene, using mRNAs as a comparator. This type of analysis was motivated by something that I did not know: at some lncRNA loci, the mere act of transcription is functionally relevant, but the actual sequence of the transcript is not.
The image to the right (adapted from Figure 1c) shows the proportion of transcription initiation regions (Y-axis) and exonic regions (X-axis) that overlap GERP-predicted conserved sequences for mRNAs (red), divergent p-lncRNAs (purple), intergenic p-lncRNAs (blue), and enhancer-lncRNA (green). Classic mRNAs, as expected, show conservation at both the TIR and the exonic portions.
In general, exonic regions from all three lncRNA categories were less conserved by comparison. Divergent p-lncRNAs showed high conservation for the TIR (75%) and a reasonable amount for the exon (54%), but remember that their “exonic” portion, by definition, is immediately upstream of an mRNA core promoter. In intergenic regions, 42% of promoter-like lncRNAs and 36% of enhancer-like lncRNAs did not overlap conserved elements.
Interestingly, those non-conserved intergenic TIRs were significantly enriched for retrotransposons, suggesting that retrotransposon activity contributes to the “birth” of new transcription activity in noncoding regions.
lncRNAs Expression Patterns
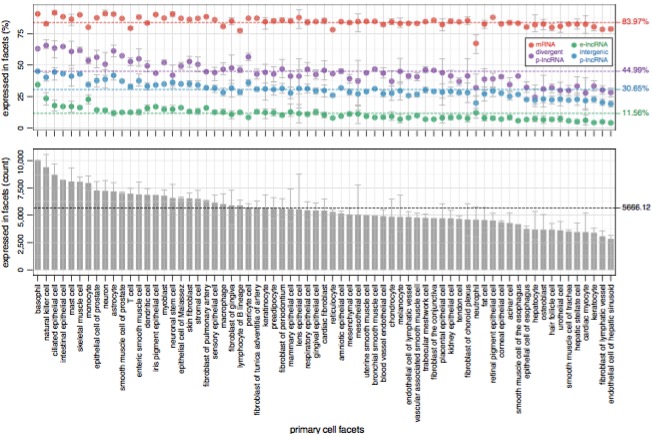
Next, the authors examined the expression patterns of lncRNAs across a variety of primary cell types. The expression levels of each category were relatively consistent across cell types. Around 45% of divergent p-lncRNAs (purple) and 31% of intergenic p-lncRNAs (blue) were expressed in each primary cell type, but the proportion of enhancer-like lncRNAs expressed (12%, green) was much lower:
Enhancer-lncRNAs were also much more likely to be cell-type-specific, which is consistent with previous studies of enhancer activity. On average, 5,666 lncRNA genes were expressed in each cell type, though the range was fairly wide (3,000-10,000). I notice that many of the higher-activity cell types in the bottom panel are immune cells (basophils, NK cells, etc), which makes sense.
Association with Human Traits
The authors cross-referenced lncRNAs from FANTOM CAT with established GWAS loci, finding that 40.7% of lncRNA genes were associated with at least one trait. Unsupervised clustering of cell-type-specific lncRNAs and trait associations showed that related cell types and traits tend to clump together in biologically plausible ways: for example, lncRNAs enriched in nervous system tissues tended to be associated with neuropathy and behavior traits, and the odds ratios of lncRNA genes were comparable to those of mRNA genes.
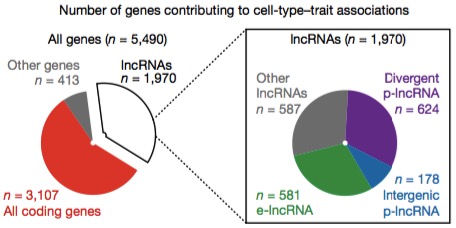
The authors identified groups of mRNAs and lncRNAs that are active in the same cell types and associated with the same traits, i.e. “significant cell type-trait pairs.” Some 5,490 FANTOM CAT genes were involved in such pairs:
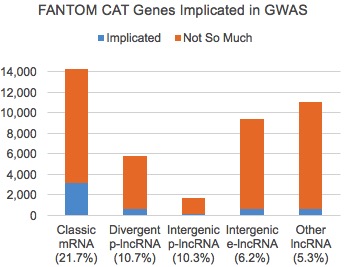
Most of those were protein-coding genes (mRNAs), but a significant proportion, around 36%, were lncRNA genes. Before we react too much to the distribution among gene categories, let’s remember that the relative sizes differ. If I compare the number of genes associated with cell-trait pairs to the total number in FANTOM-CAT, here’s what it looks like:
As we might expect, protein coding genes had the highest proportion of associations (21.7%), and they were about twice as likely as divergent/intergenic p-lncRNAs and thrice as likely as enhancer-like lncRNAs to be involved in a cell type-trait association. Even so, given the massive disparity in research emphasis, I find it compelling that considerable numbers of lncRNAs are implicated in human traits.
It suggests that all of those noncoding genetic associations are not random, but indicative of the intricate regulatory genetic networks underlying complex human traits. Furthermore, it highlights the importance of divergent p-lncRNAs, which utilize the same TSS as protein-coding mRNAs but are divergently transcribed. Given their close proximity and the tendency of investigators to assign a GWAS hit to the nearest protein-coding gene, I wonder how often a genetic signal from a p-lncRNA is erroneously assigned to the mRNA instead.
