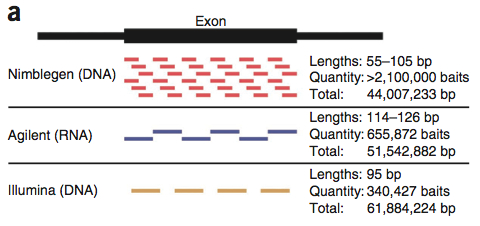
A few recent studies have sought to compare commercial exome sequencing technologies. These kits, which selectively target coding regions for next-generation sequencing, have matured rapidly over the past couple of years. I like the recent study out of Michael Snyder’s lab (Stanford)the best. In it, the authors compared three major exome platforms – Agilent’s SureSelect Human All Exon (50 Mbp), Roche/Nimblegen’s SeqCap EZ v2.0, and Illumina’s TruSeq Exome Enrichment – to each other and to whole-genome sequencing (35x), all for a single individual.
Differences in Target Space
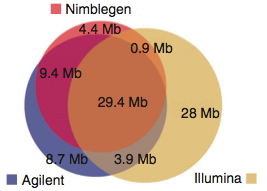
First off, a comparison of the declared exome targets for each platform.
A large number of bases (29.45 Mbp), presumably the “meat” of the exome are targeted by all three platforms. Individually, the platforms have 4-28 Mbp of unique target space. Agilent does better for Ensembl transcripts; Nimblegen has better coverage of miRNAs. These two platforms share more target space with each other than either did with the Illumina platform. This is primarily because Illumina goes after untranslated regions (UTRs). I can’t decide if this is an advantage or not. On one hand, it certainly appeals to the investigator interested in variation in UTR regions. On the other, that’s a lot to sequence. Indeed, the authors note that 50 million 2×100 bp reads yield only 30x coverage on the Illumina platform, compared to 60x for Agilent and 68x for Nimblegen.
Target Enrichment Efficiency and GC Content
The authors performed exome capture and sequencing on a single sample – a healthy volunteer of European descent – using all three exome kits. Each exome library got one lane of 2×100 bp reads on the Illumina HiSeq 2000 (11 to 18 Gbp per library). BWA mapped 99% of these to the reference sequence, and some 10-15% were PCR duplicates. Overall targeting efficiency was measured using 80 million reads for each exome, and evaluating the fraction of bases covered at 10x, 20x, and 30x. The authors wrote “At all read counts and depth cut-offs, the Nimblegen platform enriched a higher percentage of its targeted bases than the other two platforms.” They attribute this efficiency to the higher-density, overlapping baits used by the Nimblegen platform.
Unsurprisingly, all platforms demonstrated a marked reduction in coverage over high and low GC targets. At low GC (40% to 20%), however, the Agilent platform showed only a slight decrease in read depth, possibly due to fewer PCR cycles, longer baits, and/or the use of RNA probes that were unique to this platform.
Detection of Single Nucleotide Variants (SNVs) and Small Indels
Detection of small sequence variants, especially SNVs, is a major goal of exome sequencing. Using the normalized ~80m read sets, the authors performed SNV detection (using GATK) in each exome. All three platforms showed high concordance between SNV calls and high-density SNP array genotypes. The reference allele was slightly favored (0.53-0.55) at SNP positions, suggesting slight mapping bias against variant-containing reads. However, there were no biases toward or against specific substitution types. For all platforms, the SNV count increased as the coverage increased. This increase was not linear, however; at 30 million reads, over 95% of SNVs were detected. In shared regions, Nimblegen consistently captured the most SNVs and became saturated with the lowest number of reads.
Nimblegen also detected the most indels in shared and RefSeq regions, owing to more efficient capture and thus deeper coverage. At low read counts, Agilent detected more indels in shared regions, but at 50 million reads, Illumina surpassed Agilent (and, unsurprisingly, detected many more UTR indels). Most indels were 1bp in size, though the authors saw slight enrichment of indels in the 4bp and 8bp bins (consistent with human-primate genome comparisons), as well as the multiple-of-three enrichment expected due to selection against frameshift mutations.
Comparison with Whole-Genome Sequencing
A key strength of this study was that the authors also performed whole-genome sequencing to 35x mean coverage on the sample that was evaluated. WGS data had 98.5% concordance at heterozygous SNP positions as detected by SNP array. To simulate the multiplexed sequencing of 3 or 6 exome libraries per lane (GAIIx or HiSeq, respectively), the authors normalized exome datasets to 50 million reads apiece. In each exome-WGS comparison, the WGS dataset was restricted to regions targeted by that exome product. This step seems necessary for an apples-to-apples comparison, but I should note that it minimizes the strength of WGS, which provides relatively unbiased coverage across all coding regions. In other words, this restriction slightly favors the exome dataset by examining only regions that its platform was willing, and able, to target.
The vast majority of SNVs in exome space were detected by both exome and WGS data, but there were some differences. Notably, the exome-specific and WGS-specific calls in each comparison tended to have (1) lower confidence scores, (2) higher proportions of novel-to-dbSNP variants, and (3) better coverage in the detection platform. WGS-specific SNVs often had zero reads in the exome data (probably hybridization failure). In contrast, most exome-specific SNVs had coverage in WGS, though it tended to be lower.
It seems clear from this figure that the number of SNVs detected by exome and WGS is correlated to the “reach” of the exome platform. Illumina, which had the biggest target space and also went after UTRs, had the highest number of shared SNVs. Agilent had more than Nimblegen, but Nimblegen’s sensitivity for true positives in its target regions was much higher than that of the other two platforms.
How to Choose an Exome
The authors conclude that all three exome platforms are pretty good. Choosing among them probably depends on the goals, priorities, and budget of the investigator. For the cost-conscious, Nimblegen offers the most efficient enrichment of exons (and also of miRNAs). For the variant-hunters, Agilent provides a wider reach but requires a bit more sequence data. Illumina requires the most sequence data, but it alone surveys untranslated regions, which might appeal to some researchers.
References
Clark MJ, Chen R, Lam HY, Karczewski KJ, Chen R, Euskirchen G, Butte AJ, & Snyder M (2011). Performance comparison of exome DNA sequencing technologies. Nature biotechnology, 29 (10), 908-14 PMID: 21947028


[…] higher coverages (100x) are sometimes required. Last but not least, coverage and read lengths might differ between NGS platforms, complicating matters even further. Figure 1. Circling in on exome data. When comparing the […]