 A recent issue of Nature featured two articles from the FANTOM5 project, an effort to systematically study gene expression and regulation by performingg capped analysis of gene expression (CAGE) across a diversity of cell types. FANTOM5 has generated single molecule CAGE profiles for 574 primary human cell samples, each sequenced to a median depth of ~4 million mapped tags per sample. CAGE is essentially a technology to isolate short sequence tags from capped RNAs. The approach was pioneered at RIKEN and is useful for determining transcription start sites (i.e., the regions of the genome corresponding to the capped 5′ end of RNAs).
Inferring Transcription Start Sites
CAGE tags are short, and thus can be directly sequenced using current NGS technologies. When mapped to the genome, they tell us not only about the level of expression for various genes, but also which transcription start sites were used. This is an advantage of RNA-seq and microarray-based expression profiling, which can’t always distinguish between multiple promoters of the same gene.
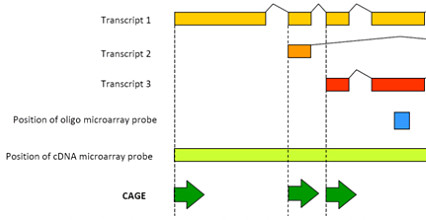
CAGE technology overview (RIKEN)
Also, CAGE data can be used to identify in-vivo transcribed enhancers, which are remote elements that increase transcription of a gene, independent of their distance or orientation to the gene’s promoter.
CAGE Advantages & Dataset
Also, because FANTOM5 generated all of the data on a single molecule sequencing platform (Helicos), there’s no PCR or cloning bias to worry about. Every read represents the 5′ end of a unique RNA molecule. Thus, the FANTOM5 dataset nicely complements the open chromatin, CHiP-Seq, and RNA-seq data generated by the ENCODE project.
The complete FANTOM5 dataset includes CAGE profiles for:
- 573 human primary cell samples (~3 donors for most cell types)
- 250 different cancer cell lines
- 152 human post-mortem tissues
- 128 mouse primary cell samples
- 271 mouse developmental tissue samples
All samples were annotated using structured ontologies, and made available in the FANTOM5 online resource along with a genome browser for exploring the relationship between CAGE tag distribution and expression profiles.
Gene Promoters
The authors developed a method called decomposition-based peak identification (DPI) to cluster CAGE tags and identify the peaks, which should represent transcription start sites (TSSs). Sample and genome-wide, DPI identified 3.5 million peaks in the human genome and 2.1 million peaks in the mouse genome. Next, they applied tag evidence thresholds to define “permissive” and “robust” datasets, with the latter more stringent set used for most of the analysis.
Matching DPI peaks to the 5′ end of known genes within 500 bp revealed that 91% of human protein-coding genes had a TSS supported by robust CAGE peaks. This is pretty impressive coverage for an expression dataset, since not all genes will be “turned on” in every sample. To me, it suggests that the broad panel of primary cell samples captures most genes that it should, including the differentially expressed ones. Almost all peaks (96%) were observed in at least 2 samples, but most were present in less than half of samples, suggesting a lot of cell/tissue/sample specificity.
Nucleosomes and Preferred TSSs
The FANTOM5 dataset supports the previous observation that gene promoters can be classified as either “broad” or “sharp” types, i.e. genes with many or few TSSs. However, for genes with broad promoters (many TSSs), the CAGE dataset provided enough depth to identify which TSS seems to be preferred. Using this dominant TSS, the authors searched for phased dinucleotides associated with nucleosome location (AA/AT/TA/TT). There was a striking pattern of such motifs repeated about 10.5 bp downstream of the dominant TSS, suggesting that the nucleosomes have something to do with TSS preference in broad promoters.
Evolutionary Conservation of Gene Promoters
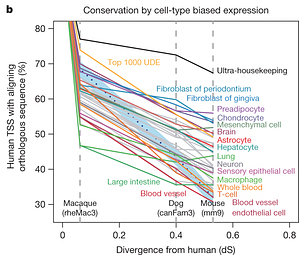
TSS conservation by cell type (FANTOM Cons., Nature 2014)
About 38% of human TSSs overlapped previously-defined sequences that are evolutionarily conserved in mammals. TSSs for protein-coding genes were more conserved than those of noncoding RNAs. TSSs of housekeeping (essential) genes showed the highest conservation. Interestingly, TSSs that were specific to one cell or tissue type were more likely to change through evolution:
- TSSs in fibroblasts, chondrocytes, and pre-adipocytes were among the most conserved
- TSSs in T-cells, macrophages, dendritic cells, whole blood, and endothelial cells were the least conserved
You might notice something about the least conserved TSSs: they’re all related to immunity, suggesting that cells/tissues of the immune system are rapidly evolving.
Other Promoter Observations
There’s too much good stuff in this paper to cover it all, but here are some of the highlights:
- Only 54% of human TSSs and 61% of mouse TSSs that were in human-mouse conserved regions had peaks in the other species.
- The authors obtained promoter-level expression profiles for 1,665 of 1,762 human transcription factors (94%).
- A typical primary cell had ~8,752 TSSs expressed at 3 or more copies per cell, including 430 corresponding to known transcription factors.
- CHiP-Seq data show that cell-type-specific promoters are enriched for cell-type-specific transcription factors.
- A small number of highly-abundant RNAs (HBB, SMR3B, STATH, PRB4, CLPS, HTN3, SERPINA1, CTRB2, CPB1, CPA1, and MALAT1) accounted for 20% or more of the reads in some libraries.
Comprehensive Enhancer Discovery
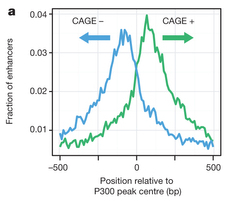
Andersson et al, Nature 2014
This CAGE dataset also contained many TSSs not associated with known protein-coding genes. In a companion paper, Andersson et al show that balanced bi-directional CAGE peaks are a signal of active enhancers. This is fascinating stuff. The forward- and reverse-oriented peaks were usually separated by around 180 base pairs, and corresponded to nucleosome boundaries.
The authors identified 43,011 candidate enhancers across 808 human CAGE libraries. These candidates were depleted for CpG islands and repeats, and 95% of the RNAs from them were short, unspliced transcripts (median 346 nucleotides long) very unlike typical mRNAs. Another difference from mRNAs: both sense and antisense transcripts from enhancers were sensitive to degradation by the exosome complex. In contrast, only antisense mRNAs are degraded by the exosome. TSSs of mRNAs and enhancers seemed to have similar RNA-PolII initiation elements, but motif analysis suggests that enhancers are more similar to non-CpG island promoters.
This is fascinating stuff, and a great companion paper to the promoter atlas paper. We need more studies like these (and ENCODE) to fully understand the function of the human genome.
References
FANTOM Consortium and the RIKEN PMI and CLST (DGT) (2014). A promoter-level mammalian expression atlas. Nature, 507 (7493), 462-70 PMID: 24670764
Andersson R, Gebhard C, Miguel-Escalada I, Hoof I, Bornholdt J, Boyd M, Chen Y, Zhao X, Schmidl C, Suzuki T, Ntini E, Arner E, Valen E, Li K, Schwarzfischer L, Glatz D, Raithel J, Lilje B, Rapin N, Bagger FO, Jørgensen M, Andersen PR, Bertin N, Rackham O, Burroughs AM, Baillie JK, Ishizu Y, Shimizu Y, Furuhata E, Maeda S, Negishi Y, Mungall CJ, Meehan TF, Lassmann T, Itoh M, Kawaji H, Kondo N, Kawai J, Lennartsson A, Daub CO, Heutink P, Hume DA, Jensen TH, Suzuki H, Hayashizaki Y, Müller F, FANTOM Consortium, Forrest AR, Carninci P, Rehli M, & Sandelin A (2014). An atlas of active enhancers across human cell types and tissues. Nature, 507 (7493), 455-61 PMID: 24670763
Thank you very much for the “journal club”, it helped me read the papers.
I have a small technical question about the promoter paper, and I am not sure if I am missing something and whether I should ask the authors so I thought I’d ask here first. All CAGE peaks are supposed to be assigned names, like p1@GFAP for example, so that one can link a peak to a gene. Somewhat annoyingly, this name is missing from tables S2 (human) and S3 (mouse). Table S4 has it but only for a subset of these promoters (“housekeeping”).
Do you have a guess as to whether this information available anywhere else (and I missed it), or did the authors make a mistake and forgot to include this info? It does seem rather important to me, even though one could in theory reconstruct the names from the positions.
Vince, thanks for the comment. That was my understanding of the naming convention as well. I’m hoping that you’ll be able to get that directly from the FANTOM5 project here: http://fantom.gsc.riken.jp/5/datafiles/latest/extra/CAGE_peaks/.