
(image by Tim O’Brien)
There are only about 20,000 genes in the human genome, but they generate a surprising amount of diversity. Given that 0.1% of DNA sequence differs when any two individuals are compared, and only 4% differs when a human and a chimpanzee are compared, it’s clear that protein-coding differences alone can’t account for how we differ from chimp and from one another.
Differences in gene expression, however, are virtually unlimited in their ability to influence phenotypic diversity, and we know that many of those have a genetic basis. It stands to reason that achieving our goal of identifying functional noncoding variation will require a deep understanding of how transcription is controlled at the genetic level.
Gene Expression Quantitative Trait Loci
Gene expression levels themselves are a trait that can be studied and correlated to genetic variation in a particular individual. The identification of expression quantitative trait loci (eQTLs) offers insights into the mechanisms of gene transcription regulation, and also helps interpret the results of pure genetic studies, such as the GWAS.
Since high-throughput gene expression and genotyping technologies became available, a number of studies have sought to use both on the same samples to better understand the relationship between genotype and transcription.
At the same time, efforts such as the HapMap and 1,000 Genomes projects are creating incredible resources for understanding (and exploiting) the nature of genetic variation in humans. A new study on eQTLs in Genome Research demonstrates how leveraging those resources improves the power of eQTL detection, and may help uncover much of the “missing heritability” in complex human diseases.
Gene Expression and SNP Genotype Data
Liang et al generated a dataset of global gene expression and genome-wide SNP genotypes in two family cohorts:
| Panel | Gene Expression | Samples |
| MRCA | Affymetrix Hu133A | 206 siblings of British descent ascertained from a child with asthma |
| MRCE | Illumina Human6 v1 | 550 children from 320 British families ascertained from a child with eczema |
All samples were genotyped using Illumina SNP chips (ILMN300K, ILMN100K, or both). You’ll notice, however, that the gene expression platforms were from different manufacturers. The probe design is quite different: Affy uses multiple 25 bp probes per transcript, whereas Illumina uses a single 50-mer, and there’s no guarantee that the probe sites overlap.
Even so, without making any adjustments to the data, the authors could map 2,934 individual eQTLs from the combined dataset (1534 for MRCA/Affy, 1784 for MRCE/Illumina).
Reducing False Positives and Increasing Power for eQTL Detection
The authors investigated two strategies to evaluate and improve their eQTL detection. Because current literature suggests that most eQTL associations are in cis (gene expression correlates with variants near the gene), the proportion of distant (trans) associations provides a conservative metric of false discovery rate (FDR).
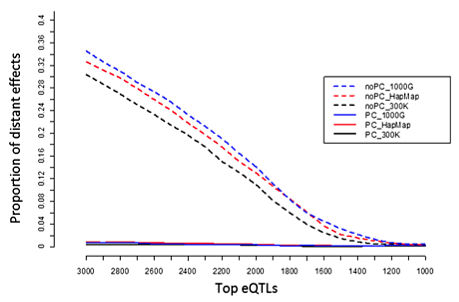
Proportion of trans effects by eQTL rank (Liang et al 2013)
Principal Components Analysis of Gene Expression
To address the influence of non-genetic effects in their expression data, the authors estimated principal components (PCs) from the gene expression values in the family panels:
- 69 PCs for the MRCA/Affy panel
- 61 PCs in the MRCE/Illumina panels.
These PCs were used as covariates in the genetic association analysis to control for non-genetic effects in the data. Notably, including top PCs yielded three times as many eQTL probesets as the un-PC-adjusted analysis.
HapMap and 1,000 Genomes Genotype Imputation
Genotype imputation — in which missing genotypes in a sample are inferred using a panel of [ethnically-matched] individuals that have already been genotyped at those positions — is a common practice when conducting genome-wide association studies. The thinking is that you can save money by genotyping only a few hundred thousand SNPs, but then impute genotypes for the rest. Well-characterized reference panels from the HapMap and 1,000 Genomes projects now make it possible to impute genotypes for millions of SNPs genome-wide.
How accurate are imputed genotypes? How do they improve the results of genetic association studies? These are two important questions that the authors were able to address in this study. Using the MaCH progrem, they were able to identify stretches of shared haplotypes between the reference panels and their study samples, and impute ~2.5 million SNPs (HapMap) or ~7.4 million SNPs (1000G) into them. Because some samples were genotyped on two platforms (Illumina 100K and 300K), they were able to measure the accuracy of this imputation genome-wide at over 60,000 SNP positions. Here’s the correlation between imputed and actual genotypes:
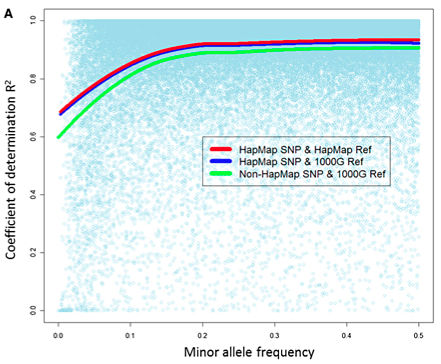
Genotype imputation accuracy (Liang et al, Genome Res. 2013)
Overall, the imputation accuracy is pretty good, with HapMap SNPs yielding slightly better results that we can probably attribute to the precision of array-based genotyping compared to low-pass whole-genome sequencing. Furthermore, imputation yielded more power to detect eQTLs: 6-7% additional signals from imputing 2.4 million HapMap SNPs, and another 5-8% more signals from imputing ~8 million 1000G SNPs.
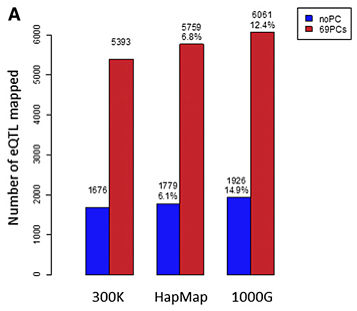
Increased power from imputation (Liang et al, Genome Res 2013)
Imputation also provided a denser and more localized map of eQTLs, which the authors nicely demonstrate for a cis-eQTL identified for TIMM22.
| Before Imputation: |
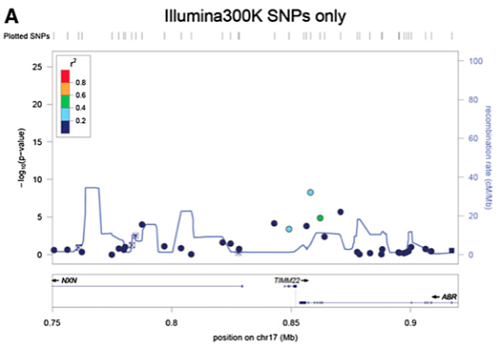 |
| After Imputation: |
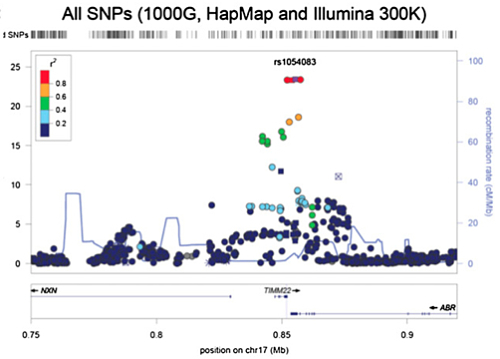 |
Conclusion: PC Adjustment and Imputation for GWAS
In summary, the authors have demonstrated that principal components analysis to control for non-genetic effects, and systematic imputation using HapMap/1000G data, serve to:
- Reduce false-positive associations
- Detect additional associations by increasing power
- Provide a denser and more precise map of genotype-phenotype associations
These results demonstrate (to my satisfaction, at least) that genotype imputation should be a standard practice whenever possible for GWAS analysis, and that such studies will have even more to gain as we continue to build ever-more-powerful maps of human genetic variation.
References
Liang L, Morar N, Dixon AL, Lathrop GM, Abecasis GR, Moffatt MF, & Cookson WO (2013). A cross-platform analysis of 14,177 expression quantitative trait loci derived from lymphoblastoid cell lines. Genome research, 23 (4), 716-26 PMID: 23345460