I got an early look at data from IonTorrent’s forthcoming semiconductor sequencing chip, called the 316. The data comes from a single sequencing run of E. coli, specifically the laboratory reference strain DH10B, not to be confused with the hybrid E. coli strain in the European outbreak that IonTorrent sequenced earlier this year. According to the run report, some 1.69 million reads were generated, of which 1.35 million were 100 base pairs or longer. It’s a nice, shiny report with color images, and of course I summarily ignored it in favor of looking at the data myself.
The data package included an SFF file, a data format often used for Roche/454 data that contains read sequences and base qualities. There was also a BAM file, which included the read sequences aligned to the E. coli reference, indexed for random access. And there was a FASTQ file, which is the common sequence-and-quality input format used by many short read aligners. So how does one go about evaluating a new sequencing dataset? This is a relevant question for bioinformaticians, who are often handed a lane or a run’s worth of data and asked, “How does it look?”. Personally, I like to start with the basics: reads, bases, and qualities. I extracted sequence and quality files from the SFF archive, downloaded the latest E. coli reference genome from NCBI, and got to work.
Distribution of Read Lengths
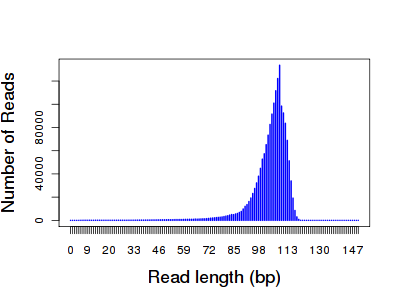
There were 1.69 million reads totaling 175,570,901 bases, which works out to an average read length of about 104 bp. Here’s my own plot of the read length distribution:

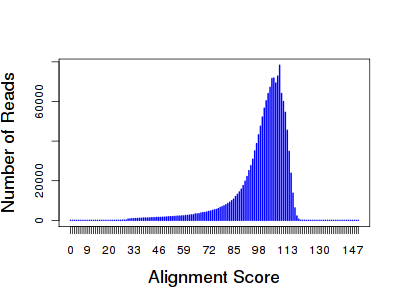
The distribution was very tight, peaking right around 100 bases. The longest read was 127 bp. Using BLAT, I mapped 1.63 million reads to the E. coli reference (96.36%), and 1.51 million (about 90%) were uniquely placed. Yes, I could have simply used the alignments provided in the BAM file, but I knew little about how they were generated. I’ll talk about those later. The BLAT-like alignment score distribution closely mirrors the read length:

What this means is that the majority of bases in each read were mapped, and most of the time, they matched the reference. You’d expect a leftward shift in the distribution if the reads contained undesired primer or barcode sequences that didn’t match the reference.
Base Quality by Read Length
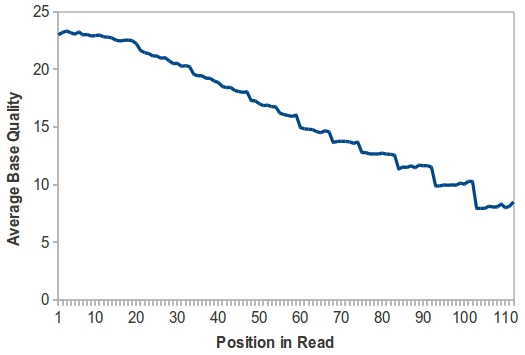
Since this is a new sequencing technology, I was keenly interested in base quality along the length of the read. If you’ll recall, early versions of the Illumina/Solexa (1×32 bp or 1×36 bp, remember those days?) showed a decline in base quality as the read went on, with a substantial drop at around 28 bp, while early 454 data had fairly uniform base quality along the length of the read. Thus, I calculated the average base quality from the first 1,600 reads in the IonTorrent FASTA file. This is where things got interesting.

You’ll notice that, like early Illumina/Solexa data, average base quality declines along the length of the read. I should point out that these are variable-length reads, so more values were used for read position 1 than, say, read position 60. Thus, it’s possible that only the last few bases in each read are low-quality, which reduces the average score as you reach the end of the reads. Also notable is the fact that the highest average base quality is 23. Remember, this is the platform’s own estimate of error rate; a score of 20 indicates that 1/100 bases will be wrong. I also noticed a lot of base quality values of 8, and wonder if this is the equivalent of Illumina’s q=2 indicating virtually no confidence in the base.
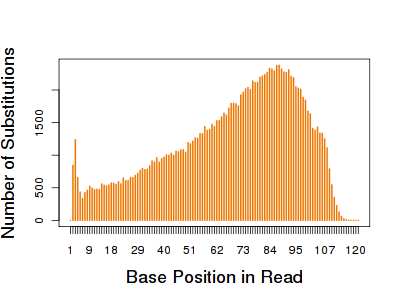
The E. coli reference genome totals about 4.69 Mbp. With 175 Mbp of data, the theoretical coverage is around 37.5-fold across the E. coli genome. Because this is a laboratory reference strain, we expect it to be genetically homogenous, and essentially identical to the reference sequence. Any apparent SNPs or indels are likely due to sequencing error. To get a handle on this, I used VarScan 1 (which parses BLAT output) to detect SNPs and indels using the ~1.51m uniquely mapped reads. Some 142,920 substitution (SNP) events were detected, reflecting a substitution error rate of 0.092%.The distribution of where those substitutions occurred indicates some interesting biases:

Most substitutions happen near the ends of reads, which is consistent with my earlier observations of base quality. There’s also a notable peak in the first few bases, which is more likely to represent an alignment artifact than true error rates. The average sequence depth across all substitutions was around 36, which is very consistent with the theoretical 37.5-fold coverage genome-wide. Looking at the context of substitutions, if one ignores a homopolymer issue (see below), the most frequent changes were T->C and A>G transitions, which often occurred when flanked by G/C bases.
Homopolymers and Insertion/Deletion Errors
VarScan detected an astonishing 1,122,276 insertion/deletion events, reflecting an indel error rate of 0.726%, or about eight-fold higher than the substitution error rate. VarScan’s heuristic filter immediately removed 983,367 indels (87.6%) because they were clear artifacts in homopolymer runs of 4 or more bases. Even the indels that passed this filter (28,182 insertions and 110,727 deletions) are mostly single base indels matching one of the flanking bases. In other words, an overcall or undercall in a homopolymer. This is very interesting, because I asked Jonathan Rothberg about this precise issue (homopolymer errors) at AGBT 2010, and he answered glibly that they wouldn’t be an issue because there wouldn’t be signal loss from the semiconductor (something about a linear pH change).
Homopolymers are obviously an issue for this platform. In fact, when I went back and looked at the context of substitutions, at least 28% of them were due to an overcall followed by an undercall, e.g. AATT sequenced as AAAT, or vice-versa. Looking at the indel distributions, it seems that C and G were most likely to be under-called (accounting for 58% of all indels), and they were far more likely to be under-called (i.e. bases missed) than over-called.
Applications and Implications
The 454-like homopolymer issue raises some concerns about using this platform for variant discovery. Yet despite the errors, I’m impressed at how rapidly the technology has matured. In just a couple of years, IonTorrent is delivering over 100 Mbp per run. In this run, at least. There’s no guarantee that Dr. Rothberg himself will do the sequencing in future experiments (just an educated guess, based on his initials in the library name). What can you do with 100 Mbp of data? Human genome and exome sequencing are out, obviously, but more targeted efforts (PCR or custom capture) could achieve high read depth. Microbial sequencing is an obvious application as well, particularly when time is of the essence. At a price that’s 1/10 of most NGS systems, IonTorrent seems rather promising.
Nice analysis Dan, you beat me to it!
I think there are a couple of typos in your last paragraph re: “1 Mbp per run”. This run was about 170Mb I believe?
Thanks, Nick! I made the corrections. 100 Mbp versus 1 Mbp is an important distinction.
Can I ask – how many – if any – SNPs occurred at a variant frequency of 1.0?
Also, isn’t it still the case that quality drops towards end of read for both Illumina and 454, at least in the datasets we get? This is more pronounced if you are pushing for long Illumina reads >100bp.
The error spike at the beginning is due to homopolymer miscalling close to the beginning (I covered this somewhere in one of my entries). TMAP or BWA would probably do a better job.
Interesting stuff and thanks for the description of the dataset. So how did your alignments of raw data compare to their four color glossy description?
There are two dials I would love to see you turn with this data. Short read cut off number and a Q value cut off number. Could there be a sweet spot for 316 ION torrent data that would filter out most of the in/dels and substitutions? Those reads with Q values of 8 could be really bolluxing up the works. Very short reads too. I would also look at a filter cut off on reads too long. Are read lengths over 113 going to be full of homopolymer crazy errors and so maybe those should be tossed too?
This dataset is created in such a different manner that filtering as if it was 454 data might really leave the crud in place that should be prefiltered prior to alignment. A Q value filter cut off of 12 and a length cut off as high as 70 looks like it would only remove a small amount of data and might make it sparkle.
Hi Dan,
Great start on an analysis. I am concerned that blat and VarScanwith untrimmed data aren’t optimal tools to analyze this data (as Keith and Paul Mention). While all reads from all platform have inherent issues, software for the most part can make up for some of it. Also, in looking at the read level, issues will be pronounced, but when calling SNPs, this won’t be an issue with oversampling to > 20X. In my look into the 316 data using Newbler and CLC, both more geared towards the error profile, and calling SNPs through our bacterial SNP calling pipeline, I get on 4 differences, and they would be filtered due to being hets. I hope to have all of this data posted on our blog soon. There are many Indels though (~1000K), so this is a problem they (and the software) need to address. My analyses agree with the read quality and length analysis you provide here – something that could use improvement on both fronts (more later). Typically for the 314 when looking at avg quality per base along a read, the average would dip below Q20 at about 60 bases. It is more around 75 now with the 316, so slightly improving. My understanding is that they are addressing one big issue at a time, with read number at forefront now, then length and quality.