A significant fraction of the functional variation in humans lies outside of known protein-coding regions. We all know that. Yet every individual’s genome harbors millions of noncoding variants, most of which are likely neutral with respect to phenotypes. Identifying the subset of noncoding variants that are functional remains notoriously difficult, and represents a considerable scientific challenge we face as we enter the whole-genome sequencing era.
Noncoding Regulatory Variation
There are many mechanisms by which noncoding variants can exert a phenotypic effect. For example:
- Variants in the untranslated regions (UTRs) can alter mRNA structure/stability
- Intronic variants can influence splicing (e.g. exon skipping, hidden exons, etc).
- Variants in noncoding RNAs (microRNAs, lincRNAs, etc) can alter their structure and function
Regulation of gene expression is another mechanism by which noncoding variants can play a functional role in cells without altering protein sequence. Aberrant gene expression has also been linked to many diseases. In cancer, for example, over-expression of oncogenes often drives tumor development, growth, and metastasis. In the other direction, many autosomal dominant Mendelian disorders are caused by haploinsufficiency (i.e. loss of one copy of a gene by deletion or mutation causes disease).
Assessing Gene Regulatory Sequences
A recent study from David Goldstein’s group investigated whether genes known to be dosage-sensitive (e.g. changes in expression cause disease) have distinct patterns of noncoding genetic variation. They used two approaches, both of which focused on noncoding variants around known protein-coding genes. For each gene, they defined the regulatory sequence as the 5′ UTR, the 3′ UTR, and the 250 base region upstream of the transcription start site. Then, they calculated several scores:
- The noncoding residual variation intolerance score (ncRVIS) is calculated by comparing the observed levels of “standing” variation to the expected levels using whole-genome sequencing data from 690 individuals.
- The protein-coding RVIS score is calculated in the same way, but using the gene’s coding sequence.
- The noncoding GERP score (ncGERP) reflects the extent of phylogenetic conservation, computed as the average GERP++ score across the regulatory sequence.
- The noncoding CADD (ncCADD) and noncoding GWAVA (ncGWAVA) scores are computed in a similar way: as the average score from these two frameworks for prioritizing noncoding variants.
To evaluate whether or not these scores can predict gene dosage sensitivity, the authors utilized four sets of genes from independent sources:
- OMIM haploinsufficient genes, in which de novo mutations are reported to cause disease
- ClinGen dosage-sensitive genes, which are curated by experts as either haploinsufficient or triplosensitive.
- Loss-of-function deficient genes, a list developed by the authors based on ~6500 exome sequences
- Dosage insensitive genes, which are inferred based on overlap with common CNVs in a public database.
Predicting OMIM Haploinsufficient Genes
First off, the authors wanted to assess how well a gene’s score predicted haploinsufficiency according to OMIM. Using a logistic regression model, they found that both RVIS and GERP scores were significantly correlated with haploinsufficient genes:

Petrovski et al, PLoS Genet, 2015
Here, the area under the curve (abbreviated AUC) is a metric for the performance of a certain score at predicting disease genes. The right-most column (HI) is the haploinsufficient gene set. We can see that the protein-coding RVIS score does extremely well, with AUC=0.712 and a very significant p-value. This makes intuitive sense, because genes in which de novo mutations cause dominant disease should exhibit strong signals of purifying selection.
It’s encouraging to see that ncRVIS and ncGERP scores also correlate with haploinsufficient genes: it not only supports these methods for assessing noncoding variation, but reinforces the notion that proximal regulatory regions are also under purifying selection for the same reason (i.e. variants within them could cause pathogenic changes to gene expression).
Coding and Noncoding RVIS Scores vs Haploinsufficiency
Figure 4 took me a while to wrap my head around, but I eventually concluded that it further illustrates the relevance of RVIS for both coding and noncoding regulatory sequences. On the Y axis below is the difference between noncoding and coding RVIS score percentiles for the same gene. So, any point above the baseline (diff=0) reflects a gene where regulatory sequences are “more intolerant” of variation. Any point below the baseline reflects a gene where coding sequences are more intolerant. On the X-axis is the sum of the two score percentiles. The lower, the more intolerant of variation. OMIM-haploinsufficient genes are marked in red:

RVIS coding vs noncoding (Petrovski et al, PLoS Genet 2015)
The most important takeaway from the figure is this: 84% of haploinsufficient genes are in the 50th percentile or better for overall RVIS. Among those 69 genes, about two thirds (45) showed greater intolerance in coding sequence than in regulatory sequence. Yet the remaining third had greater intolerance in regulatory sequences than in coding sequence, which is very surprising. It suggests that, for an appreciable portion of haploinsufficient disease genes, noncoding variation is under stronger relative (compared to other genes) purifying selection than coding variation.
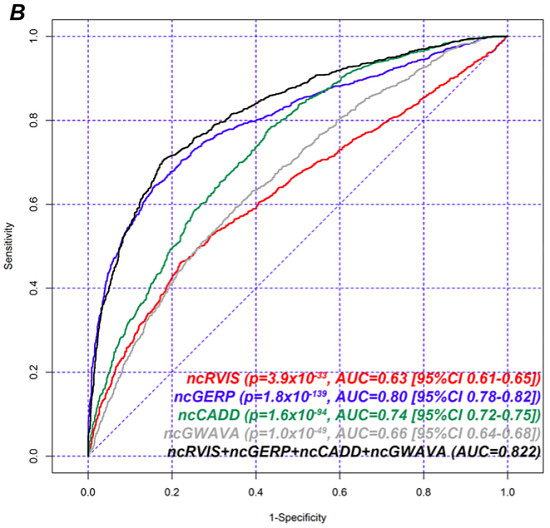
ClinGen Dosage-sensitive Genes
Next, the authors assessed gene scores using a logistic regression model for the presence or absence of a gene on ClinGen’s haploinsufficient/triplosensitive gene set. In this evaluation, they also looked at ncCADD and ncGWAVA and two joint models:

Performance on ClinGen Dosage-sensitive Genes (PLoS Genet 2015)
Again using AUC as a metric for overall performance, we can see that ncGERP outperforms all other single methods of gene scoring, followed by coding-RVIS and coding-GERP scores. The noncoding score methods (ncRVIS, ncCADD, ncGWAVA) had similar performance. Yet the joint models achieved the best overall performance, suggesting that each of these approaches brings something to the table. The overall AUC values here seem higher than for the hapolinsufficiency evaluation, suggesting that most of these methods do better at predicting ClinGen dosage-sensitive genes than OMIM haploinsufficiency genes.
Loss-of-Function Genes
Next, the authors performed a similar evaluation, but on the list of genes significantly depleted for loss-of-function variants, based on their evaluation of 6500 exomes from ESP.
Performance on LOF Gene List (PLoS Genet 2015)
Here, the noncoding RVIS score was significantly correlated with LOF-depleted genes, but nevertheless outperformed by the other approaches (GERP, CADD, and GWAVA). Kudos to the authors for owning up to the fact that other scoring approaches consistently outperform theirs. In fairness, however, algorithms such as CADD and GWAVA incorporate a huge amount of information (evolutionary conservation, ENCODE annotations, GC content, etc.), whereas the RVIS framework only incorporates variation data from WGS of a modestly-sized cohort.
Importantly, CADD, GERP, and GWAVA rely heavily on phylogenetic conservation to compute their scores. This makes them powerful discriminators of functionally relevant sequences maintained across evolution. However, it also makes them relatively blind to human-specific regulatory sequences, which likely have an important role to play in common complex diseases.
I encourage you to read the full article over at PLoS Genetics. Don’t forget the supplement: Data file 1 contains the RVIS calculations for all CCDS genes, and that alone makes this study an important resource to the research community.
References
Petrovski S, Gussow AB, Wang Q, Halvorsen M, Han Y, Weir WH, Allen AS, & Goldstein DB (2015). The Intolerance of Regulatory Sequence to Genetic Variation Predicts Gene Dosage Sensitivity. PLoS genetics, 11 (9) PMID: 26332131